Lab 3
Here are stuffs for Lab 3
Overview
This lab is short since you do not have to collect many data.
However, you might need to write a lot to describe and explana physical events.
Part 1: Finding the speed of sound (longitudinal) in an aluminum rod
Here, you have to look at 1 video that contains 2 sections corresponding 2 ways of holding the rod.
Midpoint.
A quarter length from one end.
Let’s have a look of 2 setups.
Midpoint |
A quarter length |
|---|---|
|
|
Remember in pre lab that holding a point on the rod is forcing a node there?
Your main task: Find the hamornics of the natural frequency of the rod. Steps:
Collect surrounding values near the frequency at which there is a peak in amptitude.
Take their average to represent the harmonic.
Uncertainties of the harmonics is represented by standard error.
Note
Use only the frequency hightlighted by Dr. H on the left panel.
From there, you can find the wave speed \(v\) from the formula \(v = \lambda *f\). How to find \(\lambda\)? Recall \(\lambda = \frac{2* L}{n}\), where n = # nodes.
Part 2: Waveforms, spectra and intensity
There are a few things you need to for this parts so let me break them down.
There are no data collections. Only explanations to phenomena and drawings are required.
Before we go any further, let’s have a look at the setup for tunning fork.
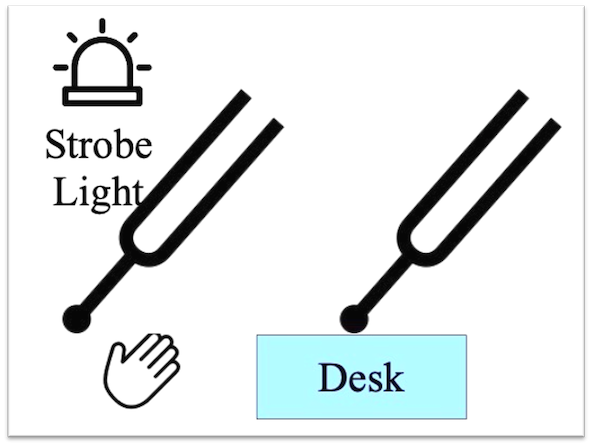
Fig. 11 Fork experiement setup
Section 1: Sketch the motion of the fork
Just draw what you observe!
I would suggest using dash lines to represent their positions at previous times.
Section 2: Describe sound quality and harmonics
Let’s answer these questions:
Was the sound clear and pure?
How many harmonics were present? Look at the FFT graph.
Where are the peaks located in FFT graphs?
Here is a sample one. Notice the peaks?
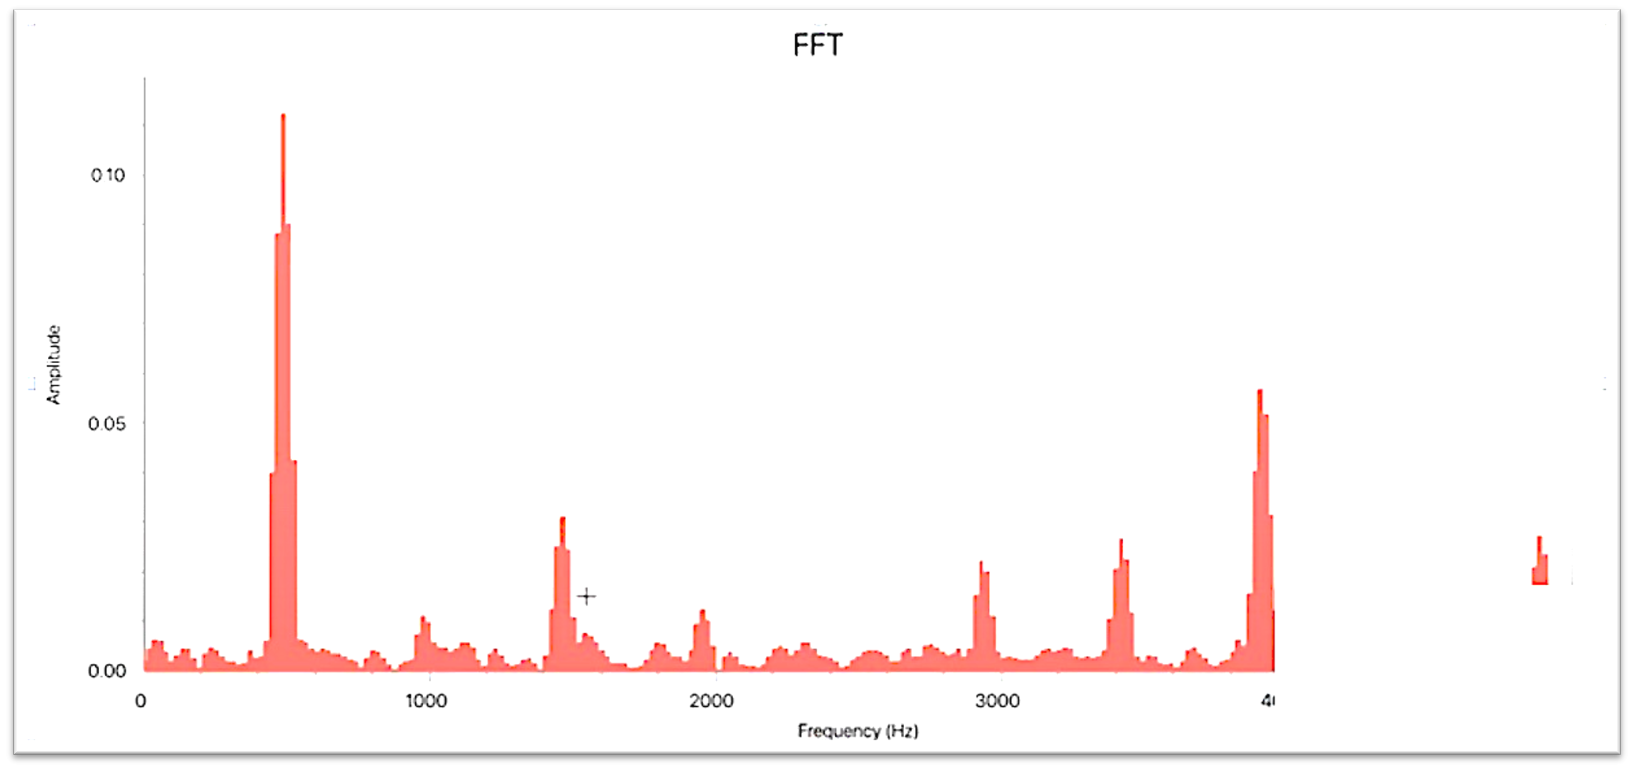
Fig. 12 Sample FFT plot
Tip
The first peak is the fundamental (first harmonics) frequency!
Section 3: Sound behaviors as tuning fork hit against the table
Just answer as your listen and observe. It should be straight-forward.
Too hard? Try these analogies:
Image the tunning fork (vibrating) touches your hand. How would your hand feel? Is it shaking?.
Imagine one person talks loudly. What happens if there are 99 more people speak the same way?
Section 4: Appearance of wave function of pitch pipe
Well, basically describe what the function looks like.
Answer these questions:
Rapid or slow oscillation? Slow means the curve is wider!
How was the sound compared to that of the tunning fork.
Section 5: Harmonics of pitch pipe
Let’s compare the FFT graph of the tunning fork and the pitch pipe.
Answer this question:
How many peaks are there in the each FFT graph?
Section 6: Chest and Falsetto voice
Falsetto voice is basically your ‘breathy’ voice, the one that sounds like Mariah Carey or Ariana Grande.
So, you just have to compare that to the normal voice (Chest voice).
Note
Please let me know if you have a better definition. And please don’t judge me if I listen to Ari’s songs.
Data Collection
Please fill your observed data in the table on page 1 (Just that one).
Uncertainties Calculation
You have to show me how you calculate the uncertainties in Part 1 via an example with actuall values.
I would recommend doing it without Excel Sheet for practice!
Discussion
Now, this is also a very tricky question! But with common sense, it is easy.
I want you to answer these questions:
What formula did we use to calculate wave speed v?
Which term in the formula is taken from experimental data?
How are the values of that term collected (experiment setup)?
Tip
The mic did not touch the rod! Right!?