Pre Lab 2
Help on pre lab 2 is here
from PIL import Image
from myst_nb import glue

im1 = Image.open("../../images/lab2/one_anti.jpg")
im2=Image.open("../../images/lab2/two_anti.jpg")
im3=Image.open("../../images/lab2/three_anti.jpg")
graph=Image.open("../../images/lab2/pre_lab2_part2.jpg")
glue('1_anti',im1, display=False)
glue('2_anti',im2,display=False)
glue('3_anti',im3,display=False)
glue('graph', graph,display=False)
Part 1
Here, you will need to derive a formula for \(\pmb{\lambda}\) from L and n (number of antinodes).
Let’s consider 3 scenarios:
1 Antinode |
2 Antinodes |
3 Antinodes |
|---|---|---|
|
|
|
Tip
Antinodes are points of maximum amptitude! Look to see which quantity is changing according to each case.
Part 2
This one requires a little bit of algebra (getting yourself really cuz its gonna get messy!)
We can summarize from the graph
 :
:
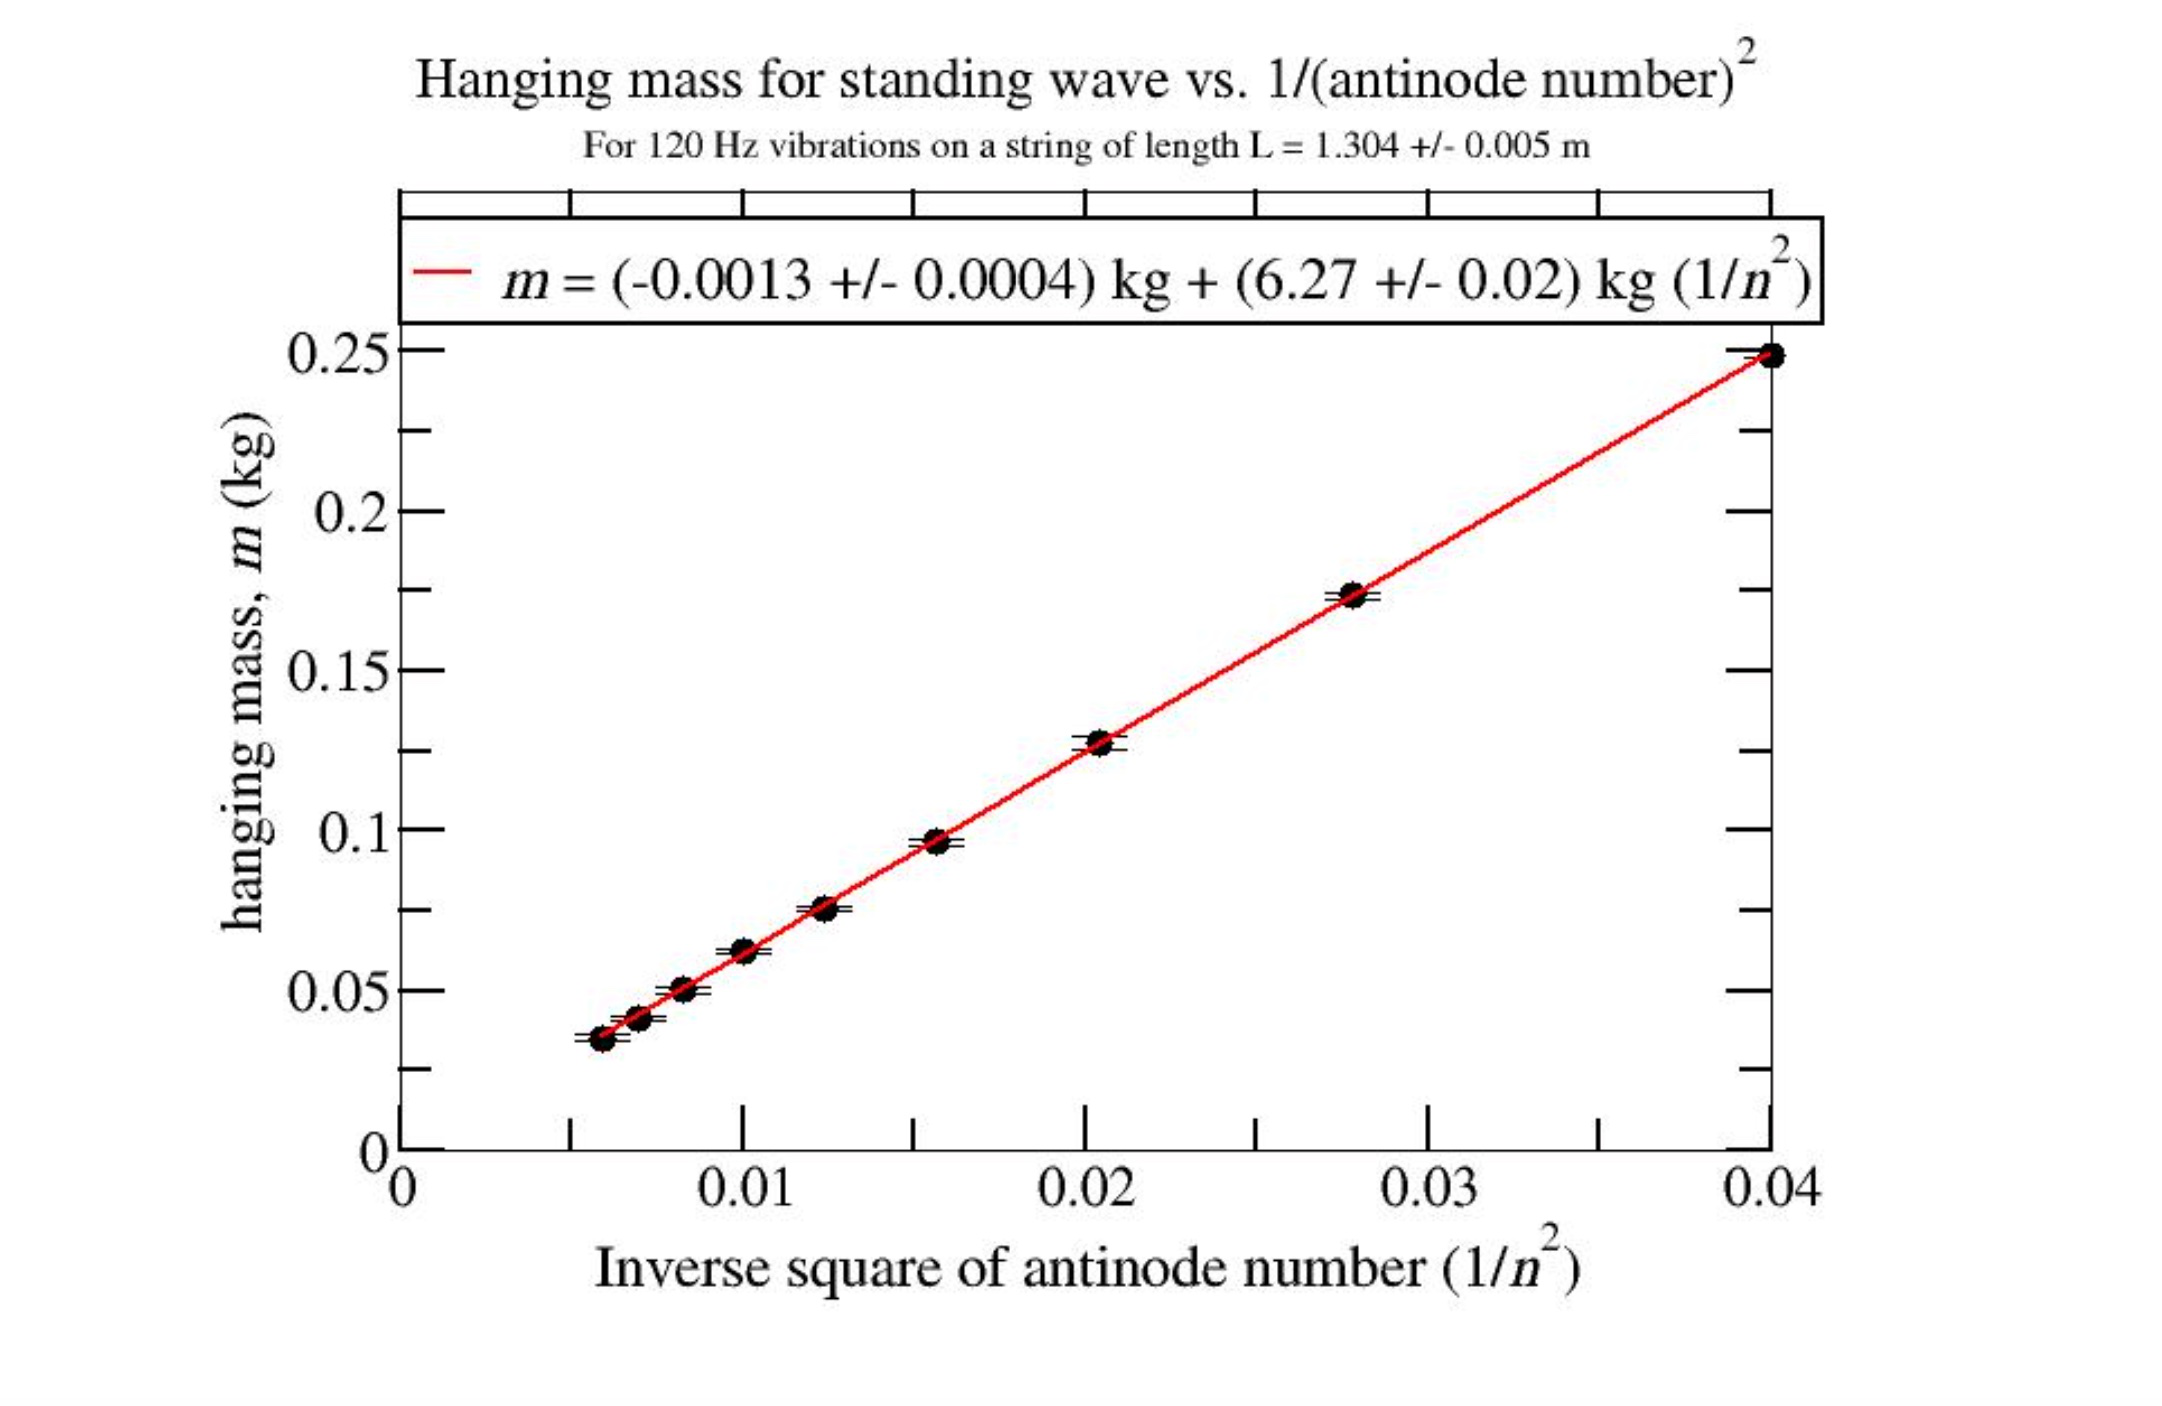
Graph
Fig. 10 Mass vs inverse squared of n plot
Summary
\(\pmb{L}\) |
\(1.304\pm{0.005} m\) |
|---|---|
\(\pmb{f}\) |
\(120.0\pm{0.1} Hz\) |
\(\pmb{slope}\) |
\(-0.0013\pm{0.0004}\) |
\(v = \sqrt{\frac{T}{\mu}} = f * \lambda\) (1) where:
\(\lambda\) = your findings in part 1
\(T = m * g\) (2), mass hanging on a spring right?
Now, look back at the graph. Ask yourself this question: Which one is the independent variable and which is the dependent variable?
Then your next step is to isolate the independent on one side and the dependent multiplying with a bunch of terms on the other.
Tip
Your bunch of terms that multiplies with the independent variable (not including the variable) is the slope!