Lab 2
Here are some stuffs for lab2!
Overview
This lab might look a little intimidating but it will turn out pretty chilled.
It might take some time!
Relax and you can do it!
Part 1: Tension Calculation
This is straightforward. And I hope everyone now knows how to calculate this.
Tip
Go back to pre lab 2 tension equation(2) for help!
Part 2: Natural frequency & Pitch
Basically, it is resonance in oscillations.
One real-life example: When you push your friend on a swing, you notice that if you push them at a certain frequency(tho you count the seconds - motion period), the swing would fly higher!
One more term to be familiar with is natural frequency. Now, you should be able to answer these questions.
Note
Objects (every? maybe) has natural frequency, in which it oscillate without any directly applied forces.
Part 3: Frequency Extraction
Now, there are 6 videos corresponding to the number of anti-nodes in each case.
All you want to extract is range of frequency that the string has the largest amplitude.
Steps to do that:
Step 1: Play the video. Of couse heh!
Step 2: Notice the first frequency mark that the string oscillates largely. Record error (~\(\pm{0.2} Hz\)).
Step 3: Notice the frequency mark that the string appears to “shrink”. Record error (~\(\pm{0.2} Hz\)).
Step 4: Take the average to find the approximated frequency (according to the lab manual). Find the error of averaging.
Enter your data in page 1.
Caution
Listen carefully. Some frequency readings increases while other decreases. Why? Dr. H’s choice? No idea.
Part 4: Calculate \(\lambda\)
You have to calculate \(\lambda\) from # of aninodes and length of string. Sound familiar?
Enter your data to the table in page 1.
Part 5: Plot and linear Fit
In this part, you will have to plot your data in Logger Pro.
Steps to plot your data:
Enter values of “n” to X column. Enter the values of frequency to Y column. (go back to Pre lab 1)
Create a new column:
Select Data > New Manual Column > Options header.
Check Error bar calculations.
Select Fixed value.
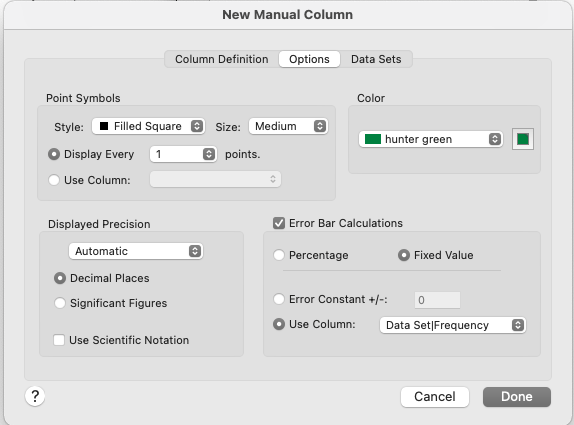
Fig. 8 How to add a new column in LoggerPro
Here is an demonstration of what your graph might look like:
import altair as alt
import pandas as pd
import numpy as np

data = pd.read_csv('../../data/lab2.csv', delimiter=',').rename(columns={'Number of Anti_nodes': 'n', 'f (Hz)': 'f','f error (Hz)': 'f_error'})

chart = alt.Chart(data, height=300, width=300).mark_circle(
    color='teal',
    size = 70,
    opacity=0.6,
).encode(
    x=alt.X('n:Q', title='Number of antinodes',scale=alt.Scale(domain=(0, 7))),
    y=alt.Y('f:Q', title='Frequency (Hz)',scale=alt.Scale(domain=(0, 100)))
).properties(
    title='Frequency vs Number of antinodes'
)

# Generate regression line
linear_fit=chart.transform_regression('n', 'f', method='linear').mark_line(color="red",strokeDash=np.array([3,3]))

# # generate the error bars
errorbars = chart.mark_errorbar(extent='stderr').encode(
    x=alt.X('x:Q'),
    yError=alt.YError(field='f_error:Q')
)

# Display the chart
alt.layer(chart,linear_fit, errorbars).interactive()
Caution
This is just a demo. Your graph should be in Logger Pro, which might look different! But it might give u a sense of what the values should be!
Part 6: Calculate \(\mu\)
Calcute \(\mu\) from the slope of best fit line. Sound familiar?
Tip
Go to pre lab 2 again!
Part 7: Describe observations
There are 3 videos to watch and answer related questions in the report sheet.
Basically, the first two include Dr. H striked a strobe light (don’t worry about what it is!) with frequency of 30 Hz and 60Hz. The third one is just him touching the string at nodes and antinodes.
What you need to do is describe how the string behaved in each case.
Tip
Listen carefully! Dr. H gave away the explanation as he did the experiment!
Data Collection and Analysis
Complete table for page 1 (Part 1,3,5,6). The below excel sheet will help you!
Uncertainties Calculation
You have to show me how you calculate the uncertainties in Part 1 via an example with actuall values.
I would recommend doing it without Excel Sheet for practice!
Discussion Question
Basically, you need to explain: At the point in contact of the vibrator (which was vibrating/moving), why is that point consider a node?
Here is a illustration for you:
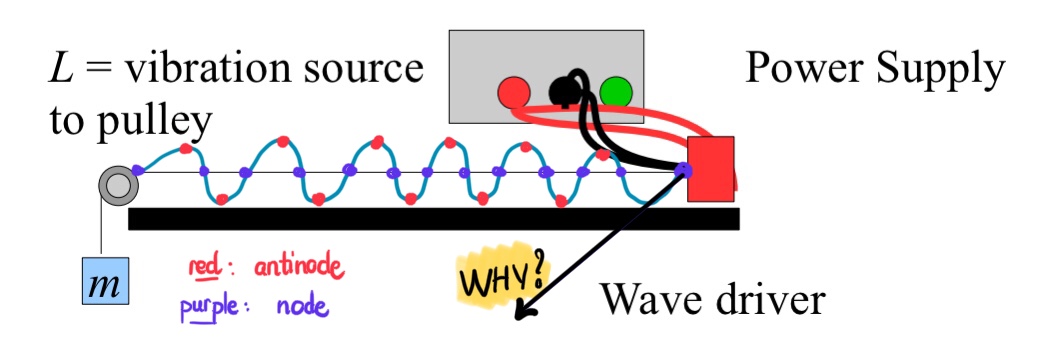
Fig. 9 Visualization of vibrating source
One more thing he asks is how you would reduce such error about that assumptions.
Tip
Just use common sense!